
Page 43 - 2020 Defence White Paper
P. 43
Appendix
5
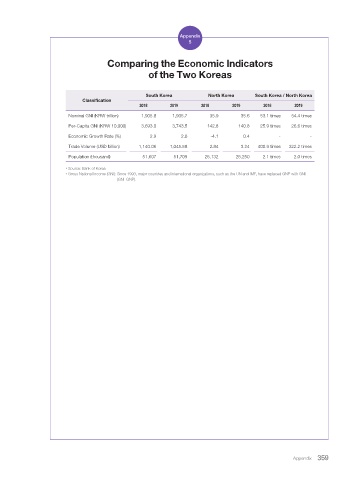
Comparing the Economic Indicators
of the Two Koreas
South Korea North Korea South Korea / North Korea
Classification
2018 2019 2018 2019 2018 2019
Nominal GNI (KRW trillion) 1,905.8 1,935.7 35.9 35.6 53.1 times 54.4 times
Per-Capita GNI (KRW 10,000) 3,693.0 3,743.5 142.8 140.8 25.9 times 26.6 times
Economic Growth Rate (%) 2.9 2.0 -4.1 0.4 - -
Trade Volume (USD billion) 1,140.06 1,045.58 2.84 3.24 400.9 times 322.2 times
Population (thousand) 51,607 51,709 25,132 25,250 2.1 times 2.0 times
* Source: Bank of Korea
* Gross National Income (GNI): Since 1993, major countries and international organizations, such as the UN and IMF, have replaced GNP with GNI
(GNI≒GNP).
Appendix