Page 29 - 2018 Defense White Paper
P. 29

Appendix 3
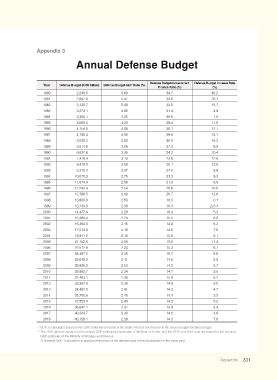
                              Annual Defense Budget


                                                           Defense Budget-Government   Defense Budget Increase Rate
                  Year  Defense Budget (KRW billion)  Defense Budget-GDP Ratio (%)
                                                              Finance Ratio (%)    (%)
                  1980        2,246.5           5.69             34.7             46.2
                  1981        2,697.9           5.47             33.6             20.1
                  1982        3,120.7           5.49             33.5             15.7
                  1983        3,274.1           4.85             31.4              4.9
                  1984        3,306.1           4.25             29.6              1.0
                  1985        3,689.2           4.23             29.4             11.6
                  1986        4,158.0           4.08             30.1             12.7
                  1987        4,745.4           3.95             29.6             14.1
                  1988        5,520.2           3.83             30.0             16.3
                  1989        6,014.8           3.68             27.3              9.0
                  1990        6,637.8           3.36             24.2             10.4
                  1991        7,476.4           3.13             23.8             12.6
                  1992        8,410.0           3.08             25.1             12.5
                  1993        9,215.4           2.97             24.2              9.6
                  1994        10,075.3          2.75             23.3              9.3
                  1995        11,074.4          2.58             21.3              9.9
                  1996        12,243.4          2.54             20.8             10.6
                  1997        13,786.5          2.60             20.7             12.6
                  1998        13,800.0          2.63             18.3              0.1
                  1999        13,749.0          2.38             16.4             ¦0.4
                  2000        14,477.4          2.28             16.3              5.3
                  2001        15,388.4          2.24             15.5              6.3
                  2002        16,364.0          2.15             14.9              6.3
                  2003        17,514.8          2.16             14.8              7.0
                  2004        18,941.2          2.16             15.8              8.1
                  2005        21,102.6          2.29             15.6             11.4
                  2006        22,512.9          2.33             15.3              6.7
                  2007        24,497.2          2.35             15.7              8.8
                  2008        26,649.0          2.41             14.8              8.8
                  2009        28,980.3          2.52             14.2              8.7
                  2010        29,562.7          2.34             14.7              2.0
                  2011        31,403.1          2.36             15.0              6.2
                  2012        32,957.6          2.39             14.8              5.0
                  2013        34,497.0          2.41             14.3              4.7
                  2014        35,705.6          2.40             14.4              3.5
                  2015        37,555.0          2.40             14.3              5.2
                  2016        38,842.1          2.37             13.9              3.4
                  2017        40,334.7          2.33             14.2              3.8
                  2018        43,158.1          2.38             14.3              7.0
                *  GDP: recalculated based on the 2010 national accounts of the Bank of Korea and based on the revised supplementary budget
                *  The 2016 data are based on the nominal GDP preliminary estimates of the Bank of Korea, and the 2017 and 2018 data are based on the nominal
                 GDP estimates of the Ministry of Strategy and Finance
                 œ Nominal GDP: Calculated by applying the prices of the relevant year to the productions in the same year


                                                                                      Appendix    331
   24   25   26   27   28   29   30   31   32   33   34